NCBI Bookshelf. A service of the National Library of Medicine, National Institutes of Health.
McEntyre J, Ostell J, editors. The NCBI Handbook [Internet]. Bethesda (MD): National Center for Biotechnology Information (US); 2002-.
This publication is provided for historical reference only and the information may be out of date.
Summary
The Gene Expression Omnibus (GEO) project was initiated at NCBI in 1999 in response to the growing demand for a public repository for data generated from high-throughput microarray experiments. GEO has a flexible and open design that allows the submission, storage, and retrieval of many types of data sets, such as those from high-throughput gene expression, genomic hybridization, and antibody array experiments. GEO was never intended to replace lab-specific gene expression databases or laboratory information management systems (LIMS), both of which usually cater to a particular type of data set and analytical method. Rather, GEO complements these resources by acting as a central, molecular abundance–data distribution hub. GEO is available on the World Wide Web at http://www.ncbi.nih.gov/geo.
Site Description
High-throughput hybridization array- and sequencing-based experiments have become increasingly common in molecular biology laboratories in recent years (1–4). These techniques are used to measure the molecular abundance of mRNA, genomic DNA, and proteins in absolute or relative terms. The main attraction of these techniques is their highly parallel nature; large numbers of simultaneous molecular sampling events are performed under very similar conditions. This means that time and resources are saved, and complex biological systems can be represented in a more holistic manner. Furthermore, the development of tissue arrays means that it is possible to analyze, in parallel, the gene expression of large numbers of tumor tissue samples from patients at different stages of cancer development (5).
Because of the plethora of measuring techniques for molecular abundance in use, our primary goal in creating the Gene Expression Omnibus (GEO) was to cover the broadest possible spectrum of these techniques and remain flexible and responsive to future trends, rather than choosing only one of these techniques or setting rigid requirements and standards for entry. In taking this approach, however, we recognize that there are obvious, inherent limitations to functionality and analysis that can be provided on such heterogeneous data sets.
This chapter is both more current and more detailed than the previous literature report on GEO (6). However, more detailed descriptions, tools, and news releases are available on the GEO Web site.
Design and Implementation
The three principle components (or entities) of GEO are modeled after the three organizational units common to high-throughput gene expression and array-based methodologies. These entities are called platforms, samples and series (Figure 1; Table 1). A platform is, essentially, a list of probes that defines what set of molecules may be detected in any experiment using that platform. A sample describes the set of molecules that are being probed and references a single platform used to generate molecular abundance data. Each sample has one, and only one, parent platform that must be defined previously. A series organizes samples into the meaningful data sets that make up an experiment and are bound together by a common attribute.
The GEO repository is a relational database, which required that some fundamental implementation decisions were made:
(a) GEO does not store raw hybridization-array image data, although “reference” images of less than 100 Kb may be stored. This decision was based on an assertion that most users of the data within the GEO repository would not be equipped to use raw image data (7); although some may disagree, this means that repository storage requirements are reduced roughly by a factor of 20.
(b) We decided to use a different storage mechanism for data and metadata. Within the GEO repository, metadata are stored in designated fields within the database table. However, data from the entire set of probe attributes (for each platform) and molecular abundance measurements (for each sample) are stored as a single, text-compressed BLOB. This mode of data storage allows great flexibility in the amount and type of information stored in this BLOB. It allows any number of supplementary attributes or measurements to be provided by the submitter, including optional or submitter-defined information. For example, a microarray (the platform) consisting of several thousand spots (the probes) would have a set of probe attributes, some of which are defined by GEO. The GEO-defined attributes include, for each probe, the position within the array and biological reagent contents of each probe such as a GenBank Accession number, open reading frame (ORF) name, and clone identifier, as well as any number of submitter-defined columns. As another example, the set of probe-target measurements given in the data from a sample may contain the final, relevant abundance value of the probe defined in its platform, as well as any other GEO-defined (e.g., raw signal, background signal) and submitter-defined data.
Once a platform, sample, or series is defined by a submitter, an Accession number (i.e., a unique, stable identifier) is assigned (Figure 2). Whether a GEO Accession number refers to a platform, sample, or series can be understood by the Accession number “prefix”. Platforms have the prefix GPL, samples have the prefix GSM, and series have the prefix GSE.
Retrieving Data
A GEO Accession number is required to retrieve data from the GEO repository database (Figure 3). An Accession number may be acquired in any number of ways, including direct reference, such as from a publication citing data deposited to GEO, or through a query interface, such as through NCBI's Entrez ProbeSet interface (covered below).
Given a valid GEO Accession number, the Accession Display tool available on the GEO Web site provides a number of options for the retrieval and display of repository contents (see Box 1).
Depositing Data
There are several formats in which data can be deposited and retrieved from GEO. For deposit: (1) a file containing an ASCII-encoded text table of data can be uploaded, and metadata fields can be interactively entered through a series of Web forms; or (2) both data and metadata for one or more platforms, samples, or series can be uploaded directly in a format we call Simple Omnibus Format in Text, or SOFT (Box 2).
Interactive and direct modes of communication are available for new data submissions and updating data submissions. The interactive Web form route is straightforward and most suited for occasional submissions of a relatively small number of samples. Bulk submissions of large data sets may be rapidly incorporated into GEO via direct deposit of SOFT formatted data.
Submissions may be held private for a maximum of 6 months; this policy allows data release concordant with manuscript publication. Such submissions are given a final Accession number at the time of submission, which may be quoted in a publication.
Currently, submissions are validated according to a limited set of criteria (see the GEO Web site for more details). Submissions are scanned by our staff to assure that the submissions are organized correctly and include meaningful information. It is entirely up to the submitter to make the data useful to others.
A quarterly, cumulative graph of the number of individual molecular abundance measurements in public submissions made through the first quarter of 2002 is shown in Figure 4.
Search and Integration
Extensive indexing and linking on the data in GEO are performed periodically and can be queried through Entrez ProbeSet (Box 3). Many users of Entrez will recognize this interface as similar to that of other popular NCBI resources such as PubMed and GenBank. As with any Entrez database, a Boolean phrase may be entered and restricted to any number of supported attribute fields (Table 2). Matches are linked to the full GEO entry as well as to other Entrez databases, currently Nucleotide, Taxonomy, and PubMed, as well as related Entrez ProbeSet entries. (See Chapter 15 for more details.) Entrez ProbeSet is accessible through the Entrez Web site as one of the drop-down menu selections.
Example of Retrieving Data
Because samples are oftentimes organized into meaningful data sets within series, an example of retrieving a series and all the data of its associated samples and platform(s) is illustrative of the retrieval capabilities of the GEO Web site. For this example, to select a series of interest, we scan down a list of series in the GEO repository. However, to arrive at our series of interest, we could have just as well performed an Entrez ProbeSet query and followed GEO accession links to a sample and then to its related series, or followed links from PubMed to Entrez ProbeSet, and then to GEO. A step-by-step example of selecting a series of data and retrieving the data for this series from the GEO repository follows:
- 1.
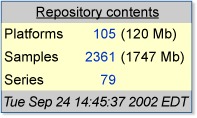
Select the linked number of public series from the table of Repository Contents given on the GEO homepage:
- 2.
Scan down the list of public series in the GEO repository and select GSE27, on sporulation in yeast:

- 3.
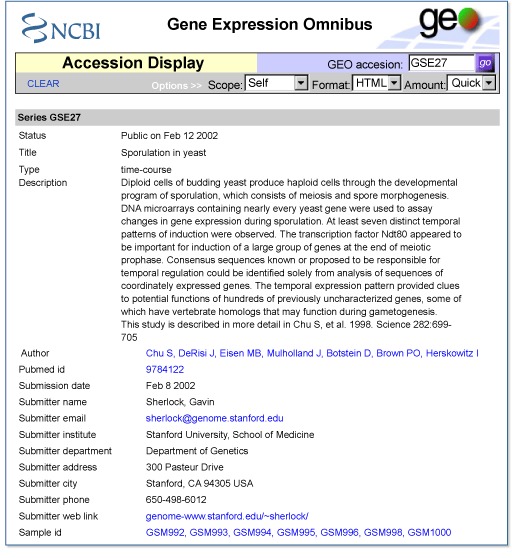
The description of GSE27 on the Accession Display allows a summary assessment of the data. The data set can be downloaded in SOFT format:
- 4.
In the Accession Display options, select Scope:Family, Format:SOFT, and Amount:Full and then press the go button:

- 5.
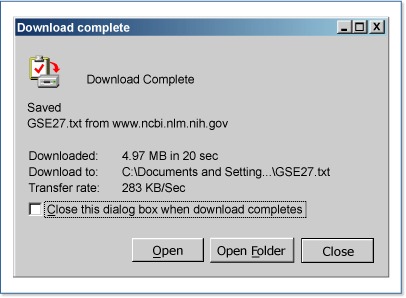
A browser dialog states that it took 19 seconds to download the 5 MB SOFT file of data and metadata for one series (GSE27), seven samples (GSM992 to GSM1000), and one platform (GPL67).
Future Directions
The GEO resource is under constant development and aims to improve its indexing, linking, searching, and display capabilities to allow vigorous data mining. Because the data sets stored within GEO are from heterogeneous techniques and sources, they are not necessarily comparable. For this reason, we have defined a ProbeSet to be a collection of GEO samples that contains comparable data. The selection of GEO samples into ProbeSets is necessary before integrating data in the GEO repository into other NCBI resources (see Chapter 15, Chapter 16, and Chapter 20), as well as for developing useful display tools for these data (Figure 5).
Frequently Asked Questions
1. How do I submit my data?
To submit data, an identity within the GEO resource must first be established. On first login, authentication and contact information must be provided. Authentication information (username and password) is used to identify users making submissions and updates to submissions. Contact information is displayed when repository contents are retrieved by others. This information is entered only once and can be updated at any time.
2. Is there a “hold until date” feature in GEO?
Yes. This feature allows a submitter to submit data to GEO and receive a GEO Accession number before the data become public. There is currently a 6-month limit to this hold period. All private data are publicly released eventually.
3. What kinds of data will GEO accept?
GEO was designed around the common features of most of the high-throughput gene expression and array-based measuring technologies in use today. These technologies include hybridization filter, spotted microarray, high-density oligonucleotide array, serial analysis of gene expression, and Comparative Genomic Hybridization (CGH) and protein (antibody) arrays but may be expanded in the future.
4. Does GEO archive raw data images?
No. However, a reference image will be optionally accepted (limited to 100 Kb in size in JPEG format). In combination with optional references to horizontal and vertical coordinates, this image can be used to provide the user of the data with a qualitative assessment of the data.
5. Are there any Quality Assurance (QA) measurements that are required by GEO?
Not at this time. These requirements may be added in the future.
6. How can I submit QA measurements to GEO?
QA measurements are currently optional. If QA measurements are performed at the image-analysis step, these can be submitted as additional sample data.
7. How can I make corrections to data that I have already submitted?
By logging in with a username and password, an option to update a previous submission or your contact information is given. Accession updates can also be made through a link from the Accession Display after logging in. Updating the data of an already existing and valid GEO Accession number will cause a new version of that data element to be created. Alterations of metadata will not create a new version. All of the various versions of a data element will remain in the database.
8. How are submitters authenticated?
In their first submission to GEO, submitters will be asked to select a username and password. This username and password can be used to submit additional data in the future without reentering contact information, as well as to authenticate the submitter when updating or resubmitting data elements under an existing GEO Accession number.
9. How do I get data from GEO?
You need not login to retrieve data. All the data are available for downloading. NCBI places no restrictions on the use of data whatsoever but does not guarantee that no restrictions exist from others. You should carefully read NCBI's data disclaimer, available on the GEO Web site.
10. What kind of queries and retrievals will be possible in GEO?
Currently, there are three ways to retrieve submissions. One way is by entering a valid GEO Accession number into the query box on the header bar of this page; this will take you to the Accession Display. Another is to use the platform, sample, and series lists, located on the GEO Statistics page. Sophisticated queries of GEO data and linking to other Entrez databases can be accomplished by using Entrez ProbeSet.
11. What does Scope mean in the Accession Display?
GEO platforms (GPL prefix) may have related samples and, through those related samples, related series. GEO samples (GSM prefix) will always have one related platform and may have multiple, related series. GEO series (GSE prefix) will have at least one related sample and, through those related samples, will have at least one related platform. The Family setting will retrieve all accessions (of different types) related to self (including Self). Please see Box 1 for more details.
12. What is SOFT?
SOFT stands for Simple Omnibus Format in Text. SOFT is an ASCII text format that was designed to be a machine-readable representation of data retrieved from, or submitted to, GEO. SOFT output is obtained by using the Accession Display, and SOFT can be used to submit data to GEO. Please see Box 2 for more details.
13. What does the word “taxon” mean?
The NCBI's Taxonomy group has constructed and maintains a taxonomic hierarchy based upon the most recent information, which is described in Chapter 4 of this Handbook.
Acknowledgments
We gratefully acknowledge the work of Vladimir Soussov, as well as the entire NCBI Entrez team, especially Grisha Starchenko, Vladimir Sirotinin, Alexey Iskhakov, Anton Golikov, and Pramod Paranthaman. We thank Jim Ostell for guidance, Lou Staudt for discussions during our initial planning for GEO, and the extreme patience shown by Brian Oliver, Wolfgang Huber, and Gavin Sherlock when making the first data submissions. Admirable patience was also exhibited by Al Zhong during the development of the direct deposit validator. Special thanks go to Manish Inala and Wataru Fujibuchi for their continuing work on future features and tools.
Contributors
Table 3 shows a collection of data sets from various sources. Ron Edgar, Michael Domrachev, Tugba Suzek, Tanya Barrett, and Alex E. Lash contributed to this NCBI resource.
References
- 1.
- Schena M , Shalon D , Davis RW , Brown PO . Quantitative monitoring of gene expression patterns with a complementary DNA microarray. Science. 1995;270:467–470. [PubMed: 7569999]
- 2.
- Lipshutz RJ , Morris D , Chee M , Hubbell E , Kozal MJ , Shah N , Shen N , Yang R , Fodor SP . Using oligonucleotide probe arrays to access genetic diversity. Biotechniques. 1995;19:442–447. [PubMed: 7495558]
- 3.
- Velculescu VE , Zhang L , Vogelstein B , Kinzler KW . Serial analysis of gene expression. Science. 1995;270:484–487. [PubMed: 7570003]
- 4.
- Emili AQ , Cagney G . Large-scale functional analysis using peptide or protein arrays. Nat Biotechnol. 2000;18:393–397. [PubMed: 10748518]
- 5.
- Leighton S , Torhorst J , Mihatsch MJ , Sauter G , Kallioniemi OP . Tissue microarrays for high-throughput molecular profiling of tumor specimens. Nat Med. 1998;4:844–847. [PubMed: 9662379]
- 6.
- Edgar R , Domrachev M , Lash AE . Gene Expression Omnibus: NCBI gene expression and hybridization array data repository. Nucleic Acids Research. 2002;30:207–210. [PMC free article: PMC99122] [PubMed: 11752295]
- 7.
- Brazma A , Hingamp P , Quackenbush J , Sherlock G , Spellman P , Stoeckert C , Aach J , Ansorge W , Ball CA , Causton HC , Gaasterland T , Glenisson P , Holstege FC , Kim IF , Markowitz V , Matese JC , Parkinson H , Robinson A , Sarkans U , Schulze-Kremer S , Stewart J , Taylor R , Vilo J , Vingron M . Minimum information about a microarray experiment (MIAME)—toward standards for microarray data. Nat Genet. 2001;29:365–371. [PubMed: 11726920]
Figures
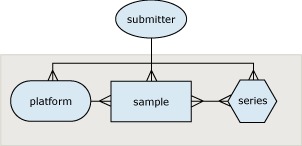
Figure 1GEO design
The entity–relationship diagram for GEO.
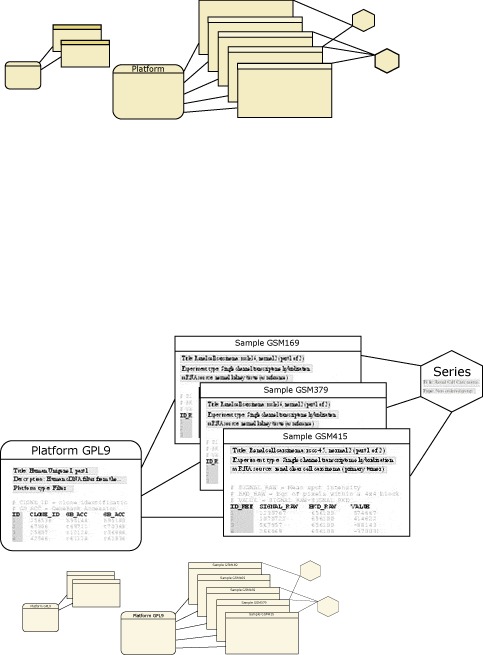
Figure 2GEO implementation example
An actual example of three samples referencing one platform and contained in a single series.
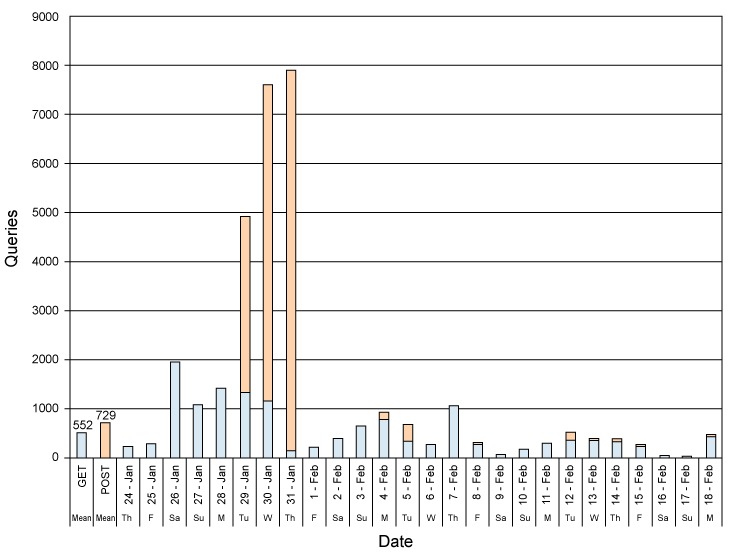
Figure 3GEO retrieval statistics
Daily usage statistics evaluated over a 4-week period January 24 to February 20, 2002. Web server GET (blue) and POST (magenta) calls are evaluated for URL http://www.ncbi.nlm.nih.gov/geo/query/acc.cgi. GET calls correspond roughly to links being followed from other Web pages, most likely following Entrez ProbeSet queries. POST calls roughly correspond to direct queries by Accession number. The spike of activity seen from January 29 to January 31 represents retrievals by one IP address and most likely represent an automated “Web crawler” pull.
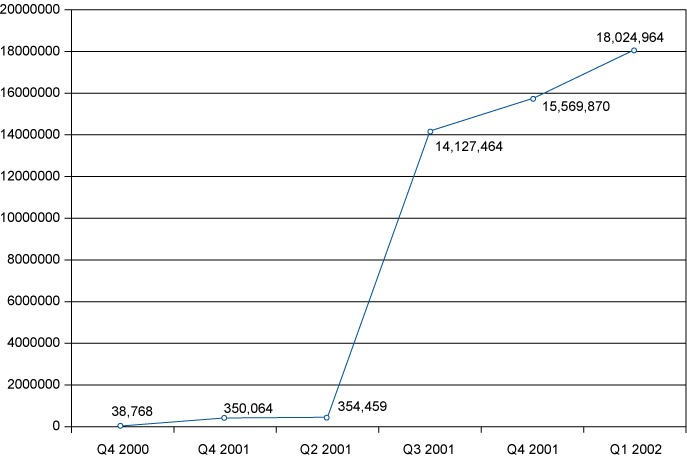
Figure 4GEO submission statistics
Cumulative individual sample measurements submitted to GEO are shown. Data are presented by quarter since operations began on July 25, 2000.
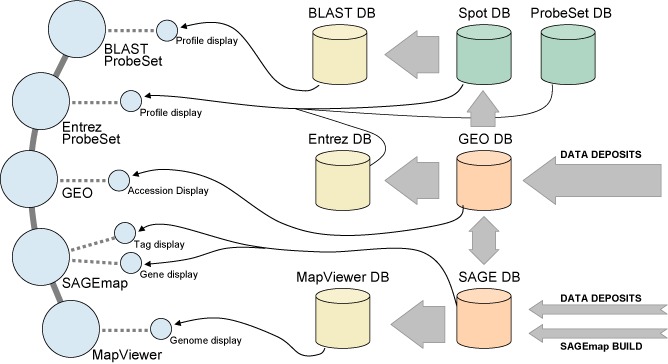
Figure 5Constellation of NCBI gene expression resources
Anticipated development of gene expression resources at NCBI is shown. Blue spheres represent Web sites, orange cylinders represent primary NCBI databases, green cylinders represent secondary databases, and yellow cylinders represent tertiary NCBI interface databases. Arrows represent data flow, and lines represent Web site links.
Tables
Table 1Entity prefixes, types, and subtypes in the GEO database
| Accession prefix | Entity type | Subtype | Description |
|---|---|---|---|
| GPL | Platform | Commercial nucleotide array | Commercially available nucleotide hybridization array |
| Commercial tissue array | Commercially available tissue array | ||
| Commercial antibody array | Commercially available antibody array | ||
| Non-commercial nucleotide array | Nucleotide array that is not commercially available | ||
| Non-commercial tissue array | Tissue array that is not commercially available | ||
| Non-commercial antibody array | Antibody array that is not commercially available | ||
| GSM | Sample | Dual channel | Dual mRNA target sample hybridization |
| Single channel | Single mRNA target sample hybridization | ||
| Dual channel genomic | Dual DNA target sample hybridization, e.g., array CGH | ||
| SAGE | Serial analysis of gene expression | ||
| GSE | Series | Time–course | Time–course experiment, e.g., yeast cell cycle |
| Dose–response | Dose–response experiment, e.g., response to drug dosage | ||
| Other ordered | Ordered, but unspecified | ||
| Other | Unordered | ||
Table 2Entrez ProbeSet fields
| Field name | Description |
|---|---|
| Accession | GEO accession identifier |
| Author | Author of GEO sample |
| CloneID | Clone identifier of GEO sample's platform |
| Country | Country of GEO sample's submitter |
| email of submitter | |
| GBAcc | GenBank Accession of GEO sample's platform |
| Institute | Institute of GEO sample's submitter |
| Keyword | Keyword of GEO sample |
| ORF | Open reading frame (ORF) designation of GEO sample's platform |
| Organism | Organism of GEO sample and its parent taxonomic nodes |
| RefSeq | RefSeq accession of GEO sample's platform |
| SAGEtag | Serial analysis of gene expression (SAGE) 10-bp tag of GEO sample |
| Subtype | Subtype of GEO sample |
| Target ref | Target reference of GEO sample |
| Target src | Target source of GEO sample |
| Text Word | Word from description of GEO sample or sample's platform, and word from the titles of sample and its platform |
| Title | Titles of GEO sample and its platform |
Table 3Selective data set survey
| Source | Accessions | Description |
|---|---|---|
| NHGRI melanoma study | GSE1 | This series represents a group of cutaneous malignant melanomas and unrelated controls that were clustered based on correlation coefficients calculated through a comparison of gene expression profiles. |
| Stanford Microarray Database | GSE4 to GSE9, and GSE18 to GSE29 | These series represent microarray studies from the public collection of the Stanford Microarray Database (SMD). |
| Cancer Genome Anatomy Project | GSE14 | This series represents the Cancer Genome Anatomy Project SAGE library collection. Libraries contained herein were either produced through CGAP funding or donated to CGAP. |
| Affymetrix Gene Chips™ | GPL71 to GPL101 | These platforms represent the latest probe attributes of the commercially available Affymetrix Gene Chips™ high density oligonucleotide arrays. |
| National Children's Medical Center Microarray Center | GSM1131 to GSM1345 | These samples represent direct deposits of data derived from Affymetrix Gene Chip™ arrays and come from the Microarray Center database at the National Children's Medical Center. |
Boxes
Box 1GEO Web site Accession Display tool
It is very easy to use the Accession Display tool:
- 1.
Type in a valid public or privatea GEO Accession number in the top GEO accession box.
- 2.
Select desired display options.
- 3.
Press the Go button.
Three types of display options are currently available:
- Scope allows you to display the GEO accession(s) that you want to target for display. You may display the GEO accession, which is typed into the GEO accession box itself (Self), or any (Platform, Samples, or Series) or all (Family) of the accessions related to an accession. GEO platforms (GPL prefix) may have related samples and, through those related samples, related series. GEO samples (GSM prefix) will always have one related platform and may have multiple, related series. GEO series (GSE prefix) will have at least one related sample and, through those related samples, will have at least one related platform. The Family setting will retrieve all accessions (of different types) related to self (including self).
- Format allows you to display the GEO accession in human-readable, linked HTML form or in machine-readable, SOFT form (Box 2).
- Amount allows you to control the amount of data that you will see displayed. Brief displays the accession's metadata only. Quick displays the accession's metadata and the first 20 rows of its data set. Full displays the accession's metadata and the full data set. Data omits the accession's metadata, showing only the links to other accessions as well as the full data set.
- a
To view one's own private, currently unreleased accessions, login with username and password at the bottom login bar.
Box 2SOFT
Simple Omnibus Format in Text (SOFT) is a line-based, ASCII text format that allows for the representation of multiple GEO platforms, samples, and series in one file. In SOFT, metadata appear as label-value pairs and are associated with the tab-delimited text tables of platforms and samples. SOFT has been designed for easy manipulation by readily available line-scanning software and may be quite readily produced from, and imported into, spreadsheet, database, and analysis software. More information about SOFT and the submission process is available from the GEO Web site.
Box 3Entrez ProbeSet indexing and linking process
The basic unit (defined by a unique identifier, or UID, in Entrez parlance) in Entrez ProbeSet is the GEO sample, fused with its affiliated platform and series information. The indexing process iterates through all platforms in the GEO database, extracting metadata and the data table and fishing for any sequence-based identifiers such as GenBank Accession, ORFs, Clone IDs, or SAGE tags. Each sample belonging to that platform is in turn assigned a new UID and indexed with the above platform information plus any related series metadata (Table 2).
GenBank Accessions, PubMed references, and taxonomy information are also linked to the appropriate Entrez databases for cross-reference and appear in the Links section of the display. Neighbors (related intra-Entrez database links) are generated for UIDs sharing the same GEO platform or series.
